Institutional Insights: Goldman Sachs SP500 Flows & Positioning Update 3/11/26

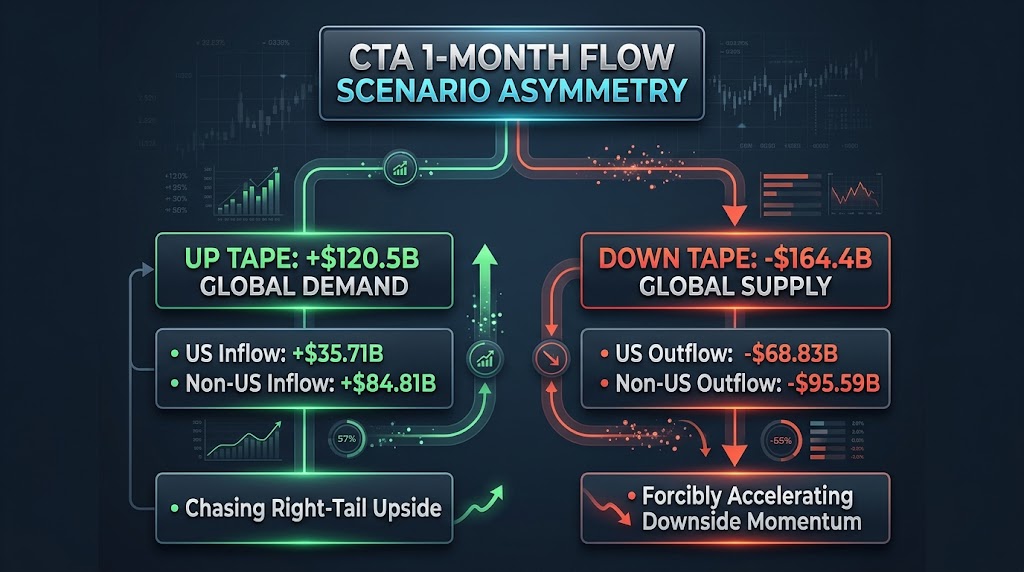
THE GOLDMAN TAKE: ASYMMETRIC 1-MONTH CTA TAILS & THE NOVEMBER BUYBACK LIQUIDITY RAMP
Goldman Sachs positioning and execution metrics show a market characterized by extreme systematic convexity and the onset of structural corporate bid support. While projected systematic CTA flows over a 1-week flat horizon remain negligible (+$1.33B globally), the 1-month forward distribution carries massive size in both tails:
Left-Tail Systematic Unwind (Down Tape): Projected selling of -$164.42B globally (-$68.83B out of the US).
Right-Tail Systematic Demand (Up Tape): Projected buying of +$120.52B globally (+$35.71B into the US).
With the S&P 500 closing at 7,541 on Monday, spot has breached both the short-term threshold (7,713) and the crucial medium-term threshold (7,544 by just 3 points). Stabilizing back above 7,544 is essential to neutralize near-term algorithmic supply.
Simultaneously, the corporate repurchase engine is accelerating into its strongest seasonal window. Peak blackout has cleared: ~60% of the S&P 500 is in an open window today, expanding to ~82% by the end of this week, providing an active liquidity backstop as companies execute against year-end targets in November (the desk's 2nd most active execution month).
CTA SYSTEMATIC FLOW MATRIX & SPX THRESHOLD LEVELS
Scenario Horizon | Flat Tape Simulation | Up Tape Simulation | Down Tape Simulation |
1-Week Horizon | +$1.33B to Buy (-$4.41B US / +$5.74B Non-US) | +$26.43B to Buy (+$5.30B into the US) | -$40.28B to Sell (-$19.98B out of the US) |
1-Month Horizon | -$11.59B to Sell (-$16.00B US / +$4.41B Non-US) | +$120.52B to Buy (+$35.71B into the US) | -$164.42B to Sell (-$68.83B out of the US) |
S&P 500 Systematic Pivot Levels:
Short-Term Threshold: 7,713 (Flipped to negative; upside recapture required to trigger short-term covering)
Medium-Term Threshold: 7,544 (Active battleground; SPX spot at 7,541 sits directly on top of this model trigger)
Long-Term Threshold: 7,082 (Structural trend support floor)
PRIME BROKERAGE: SHORT COVERING & MACRO PRODUCT REBOUND
Global Book Net Buying (+0.3 SDs 1-Year): Global equities ended a month-long selling streak to finish net bought, driven by de-grossing for a 3rd consecutive week as short covers outpaced long sales (1.8 to 1).
US Equities Turn Net Positive (+1.1 SDs 1-Year): Hedge funds were net buyers of US equities for the first time in 4 weeks, with buying heavily concentrated in Macro Products (Index & ETFs) over Single Stocks.
Macro Product Surge (+1.2 SDs 1-Year): Index and ETF wrappers saw their largest net buying in 3 months, representing 73% of total US net buying (short covers + long buys in a 1.9 to 1 ratio).
Friday Intraday Relapse (-0.7 SDs 1-Year): Despite the weekly net-long shift, Friday experienced an aggressive re-shorting wave, with short sales outpacing long purchases by 2.7 to 1.
CORPORATE BUYBACK DESK: BLACKOUT EXIT INFLECTION
Execution Volume Acceleration: Discretionary open-market orders accelerated into late last week as mega-cap reporting cleared blackout windows.
Open Window Coverage Ramp:
Current Open Window: ~60% of S&P 500 market cap is officially open.
End-of-Week Open Window: Projected to hit ~82% of S&P 500 market cap.
Seasonal Liquidity Impulse: November historically ranks as the second most active buyback execution month of the year, providing steady daily VWAP demand to absorb secondary debt/equity issuance and hedge fund de-grossing.
Disclaimer: The material provided is for information purposes only and should not be considered as investment advice. The views, information, or opinions expressed in the text belong solely to the author, and not to the author’s employer, organization, committee or other group or individual or company.
Past performance is not indicative of future results.
High Risk Warning: CFDs are complex instruments and come with a high risk of losing money rapidly due to leverage. 68% and 74% of retail investor accounts lose money when trading CFDs with Tickmill UK Ltd and Tickmill Europe Ltd respectively. You should consider whether you understand how CFDs work and whether you can afford to take the high risk of losing your money.
Futures and Options: Trading futures and options on margin carries a high degree of risk and may result in losses exceeding your initial investment. These products are not suitable for all investors. Ensure you fully understand the risks and take appropriate care to manage your risk.
Patrick has been involved in the financial markets for well over a decade as a self-educated professional trader and money manager. Flitting between the roles of market commentator, analyst and mentor, Patrick has improved the technical skills and psychological stance of literally hundreds of traders – coaching them to become savvy market operators!